Although genetic variation is, in itself, often considered to be one of the fundamental underpinnings of adaptation by natural selection, it can appear through a number of different forms. Typically, we think of genetic variation in terms of individual mutations at a single site (referred to as ‘single nucleotide polymorphisms’, or SNPs), which may vary in frequency across a population or species in response to selective pressures. However, we’ve also discussed some other types of genetic-related variation within The G-CAT before, such as differential gene expression or epigenetic markers.
The idea of using the genetic sequences of living organisms to understand the evolutionary history of species is a concept much repeated on The G-CAT. And it’s a fundamental one in phylogenetics, taxonomy and evolutionary biology. Often, we try to analyse the genetic differences between individuals, populations and species in a tree-like manner, with close tips being similar and more distantly separated branches being more divergent. However, this runs on one very key assumption; that the patterns we observe in our study genes matches the overall patterns of species evolution. But this isn’t always true, and before we can delve into that we have to understand the difference between a ‘gene tree’ and a ‘species tree’.
A gene tree or a species tree?
Our typical view of a phylogenetic tree is actually one of a ‘gene tree’, where we analyse how a particular gene (or set of genes) have changed over time between different individuals (within and across populations or species) based on our understanding of mutation and common ancestry.
However, a phylogenetic tree based on a single gene only demonstrates the history of that gene. What we assume in most cases is that the history of that gene matches the history of the species: that branches in the genetic tree mirror when different splits in species occurred throughout history.
The easiest way to conceptualise gene trees and species trees is to think of individual gene trees that are nested within an overarching species tree. In this sense, individual gene trees can vary from one another (substantially, even) but by looking at the overall trends of many genes we can see how the genome of the species have changed over time.
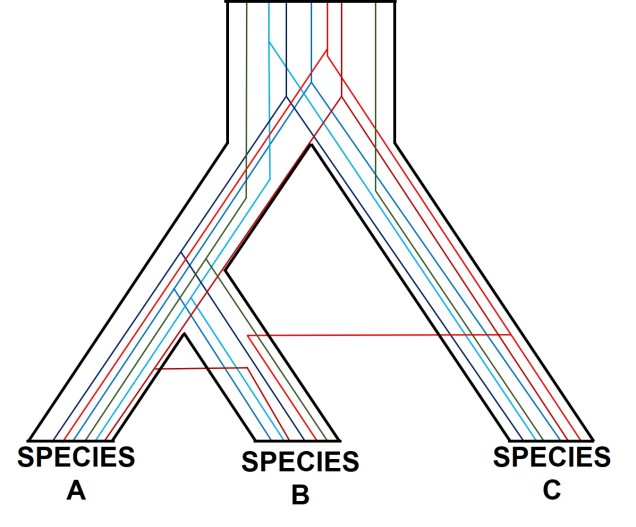
A (potentially familiar) depiction of individual gene trees (coloured lines) within the broader species tree (defined b the black boundaries). As you might be able to tell, the branching patterns of the different genes are not the same, and don’t always match the overarching species tree.
One of the most prolific, but more complicated, ways gene trees can vary from their overarching species tree is due to what we call ‘incomplete lineage sorting’. This is based on the idea that species and the genes that define them are constantly evolving over time, and that because of this different genes are at different stages of divergence between population and species. If we imagine a set of three related populations which have all descended from a single ancestral population, we can start to see how incomplete lineage sorting could occur. Our ancestral population likely has some genetic diversity, containing multiple alleles of the same locus. In a true phylogenetic tree, we would expect these different alleles to ‘sort’ into the different descendent populations, such that one population might have one of the alleles, a second the other, and so on, without them sharing the different alleles between them.
If this separation into new populations has been recent, or if gene flow has occurred between the populations since this event, then we might find that each descendent population has a mixture of the different alleles, and that not enough time has passed to clearly separate the populations. For this to occur, sufficient time for new mutations to occur and genetic drift to push different populations to differently frequent alleles needs to happen: if this is too recent, then it can be hard to accurately distinguish between populations. This can be difficult to interpret (see below figure for a visualisation of this), but there’s a great description of incomplete lineage sorting here.
A demonstration of incomplete lineage sorting, generously adapted from a talk by fellow MELFU postdocs Dr Yuma (Jonathon) Sandoval-Castillo and Dr Catherine Attard. On the left is a depiction of a single gene coalescent tree over time: circles represent a single individual at a particular point in time (row) with the colours representing different alleles of that same gene. The tree shows how new mutations occur (colour changes along the branches) and spread throughout the descendent populations. In this example, we have three recently separated species, with a good number of different alleles. However, when we study these alleles in tree form (the phylogeny on the right), we see that the branches themselves don’t correlate well with the boundaries of the species. For example, the teal allele found within Species C is actually more similar to Species B alleles (purple and blue) than any other Species B alleles, based on the order and patterns of these mutations.
Hybridisation and horizontal transfer
Another way individual genes may become incongruent with other genes is through another phenomenon we’ve discussed before: hybridisation (or more specifically, introgression). When two individuals from different species breed together to form a ‘hybrid’, they join together what was once two separate gene pools. Thus, the hybrid offspring has (if it’s a first generation hybrid, anyway) 50% of genes from Species A and 50% of genes from Species B. In terms of our phylogenetic analysis, if we picked one gene randomly from the hybrid, we have 50% of picking a gene that reflects the evolutionary history of Species A, and 50% chance of picking a gene that reflects the evolutionary history of Species B. This would change how our outputs look significantly: if we pick a Species A gene, our ‘hybrid’ will look (genetically) very, very similar to Species A. If we pick a Species B gene, our ‘hybrid’ will look like a Species B individual instead. Naturally, this can really stuff up our interpretations of species boundaries, distributions and identities.
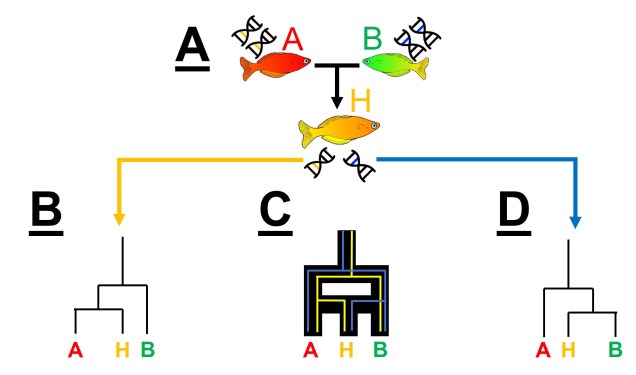
An example of hybridisation leading to gene tree incongruence with our favourite colourful fish. A) We have a hybridisation event between a red fish (Species A) and a green fish (Species B), resulting in a hybrid species (‘Species’ H). The red fish genome is indicated by the yellow DNA, the green fish genomes by the blue DNA, and the hybrid orange fish has a mixture of these two. B) If we sampled one set of genes in the hybrid, we might select a gene that originated from the red fish, showing that the hybrid is identical (or very similar) the Species A. D) Conversely, if we sampled a gene originating from the green fish, the resultant phylogeny might show that the hybrid is the same as Species B. C) If we consider these two patterns in combination, which see the true pattern of species formation, which is not a clear dichotomous tree and rather a mixture of the two sets of trees.
This can have a profound impact as paralogous genes are difficult to detect: if there has been a gene duplication early in the evolutionary history of our phylogenetic tree, then many (or all) of our study samples will have two copies of said gene. Since they look similar in sequence, there’s all possibility that we pick Variant 1 in some species and Variant 2 in other species. Being unable to tell them apart, we can have some very weird and abstract results within our tree. Most importantly, different samples with the same duplicated variant will seem similar to one another (e.g. have evolved from a common ancestor more recently) than it will to any sample of the other variant (even if they came from the exact same species)!
An example of how paralogous genes can confound species tree. We start with a single (purple) gene: at a particular point in time, this gene duplicates into a red and a blue form. Each of these genes then evolve and spread into four separate descendent species (A, B, C and D) but not in entirely the same way. However, since both the red and blue genetic sequences are similar, if we took a single gene from each species we might (somewhat randomly) sequence either the red or the blue copy. The different phylogenetic trees on the right demonstrate how different combinations of red and blue genes give very different patterns, since all blue copies will be more related to other blue genes than to the red gene of the same species. E.g. a blueA and a blueC are more similar than a blueA and a redA.
Overcoming incongruence with genomics
Although a tricky conundrum in phylogenetics and evolutionary genetics broadly, gene tree incongruence can largely be overcome with using more loci. As the random changes of any one locus has a smaller effect of the larger total set of loci, the general and broad patterns of evolutionary history can become clearer. Indeed, understanding how many loci are affected by what kind of process can itself become informative: large numbers of introgressed loci can indicate whether hybridisation was recent, strong, or biased towards one species over another, for example. As with many things, the genomic era appears poised to address the many analytical issues and complexities of working with genetic data.