The ‘other’ allele frequency: applications of the site frequency spectrum

The site-frequency spectrum

In order to simplify our absolutely massive genomic datasets down to something more computationally feasible for modelling techniques, we often reduce it to some form of summary statistic. These are various aspects of the genomic data that can summarise the variation or distribution of alleles within the dataset without requiring the entire genetic sequence of all of our samples.

One very effective summary statistic that we might choose to use is the site-frequency spectrum (aka the allele frequency spectrum). Not to be confused with other measures of allele frequency which we’ve discussed before (like Fst), the site-frequency spectrum (abbreviated to SFS) is essentially a histogram of how frequent certain alleles are within our dataset. To do this, the SFS classifies each allele into a certain category based on how common it is, tallying up the number of alleles that occur at that frequency. The total number of categories would be the maximum number of possible alleles: for organisms with two copies of every chromosome (‘diploids’, including humans), this means that there are double the number of samples included. For example, a dataset comprised of genomic sequence for 5 people would have 10 different frequency bins.

For one population

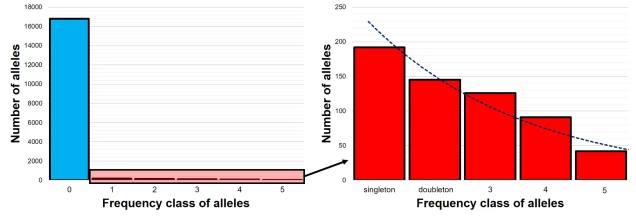
The SFS for a single population – called the 1-dimensional SFS – this is very easy to visualise as a concept. In essence, it’s just a frequency distribution of all the alleles within our dataset. Generally, the distribution follows an exponential shape, with many more rare (e.g. ‘singletons’) alleles than there are common ones. However, the exact shape of the SFS is determined by the history of the population, and like other analyses under coalescent theory we can use our understanding of the interaction between demographic history and current genetic variation to study past events.
1DSFS example.jpg
An example of the 1DSFS for a single population, taken from a real dataset from my PhD. Left: the full site-frequency spectrum, counting how many alleles (y-axis) occur a certain number of times (categories of the x-axis) within the population. In this example, as in most species, the vast majority of our DNA sequence is non-variable (frequency = 0). Given the huge disparity in number of non-variable sites, we often select on the variable ones (and even then, often discard the 1 category to remove potential sequencing errors) and get a graph more like the right. Right: the ‘realistic’ 1DSFS for the population, showing a general exponential decline (the blue trendline) for the more frequent classes. This is pretty standard for an SFS. ‘Singleton’ and ‘doubleton’ are alternative names for ‘alleles which occur once’ and ‘alleles which occur twice’ in an SFS.

Expanding the SFS to multiple populations

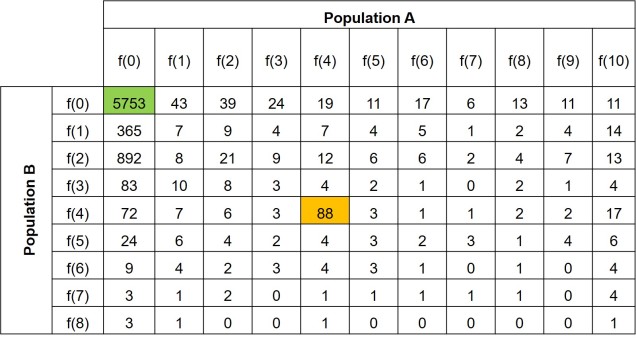
Further to this, we can expand the site-frequency spectrum to compare across populations. Instead of having a simple 1-dimensional frequency distribution, for a pair of populations we can have a grid. This grid specifies how often a particular allele occurs at a certain frequency in Population A and at a different frequency in Population B. This can also be visualised quite easily, albeit as a heatmap instead. We refer to this as the 2-dimensional SFS (2DSFS).
2dsfs example
An example of a 2DSFS, also taken from my PhD research. In this example, we are comparing Population A, containing 5 individuals (as diploid, 2 x 5 = max. of 10 occurrences of an allele) with Population B, containing 4 individuals. Each row denotes the frequency at which a certain allele occurs in Population whilst the columns indicate the frequency a certain allele occurs in Population A. Each cell therefore indicates the number of alleles that occur at the exact frequency of the corresponding row and column. For example, the first cell (highlighted in green) indicates the number of alleles which are not found in either Population A or Population B (this dataset is a subsample from a larger one). The yellow cell indicates the number of alleles which occur 4 times in Population and also 4 times in Population A. This could mean that in one of those Populations 4 individuals have one copy of that allele each, or two individuals have two copies of that allele, or that one has two copies and two have one copy. The exact composition of how the alleles are spread across samples within each population doesn’t matter to the overall SFS.

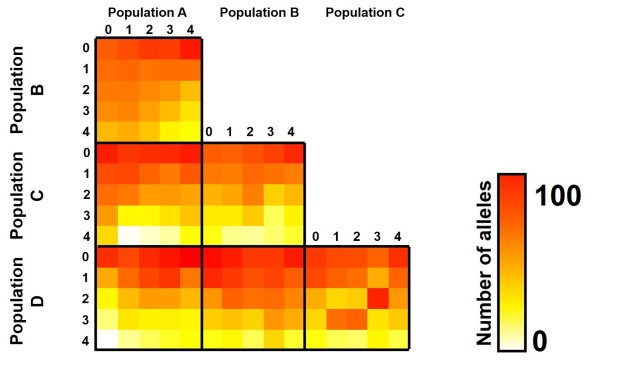
The same concept can be expanded to even more populations, although this gets harder to represent visually. Essentially, we end up with a set of different matrices which describe the frequency of certain alleles across all of our populations, merging them together into the joint SFS. For example, a joint SFS of 4 populations would consist of 6 (4 x 4 total comparisons – 4 self-comparisons, then halved to remove duplicate comparisons) 2D SFSs all combined together. To make sense of this, check out the diagrammatic tables below.

populations for jsfs
A summary of the different combinations of 2DSFSs that make up a joint SFS matrix. In this example we have 4 different populations (as described in the above text). Red cells denote comparisons between a population and itself – which is effectively redundant. Green cells contain the actual 2D comparisons that would be used to build the joint SFS: the blue cells show the same comparisons but in mirrored order, and are thus redundant as well.
annotated jsfs heatmap
Expanding the above jSFS matrix to the actual data, this matrix demonstrates how the matrix is actually a collection of multiple 2DSFSs. In this matrix, one particular cell demonstrates the number of alleles which occur at frequency x in one population and frequency y in another. For example, if we took the cell in the third row from the top and the fourth column from the left, we would be looking at the number of alleles which occur twice in Population B and three times in Population A. The colour of this cell is moreorless orange, indicating that ~50 alleles occur at this combination of frequencies. As you may notice, many population pairs show similar patterns, except for the Population C vs Population D comparison.

The different forms of the SFS

Which alleles we choose to use within our SFS is particularly important. If we don’t have a lot of information about the genomics or evolutionary history of our study species, we might choose to use the minor allele frequency (MAF). Given that SNPs tend to be biallelic, for any given locus we could have Allele A or Allele B. The MAF chooses the least frequent of these two within the dataset and uses that in the summary SFS: since the other allele’s frequency would just be 2N – the frequency of the other allele, it’s not included in the summary. An SFS made of the MAF is also referred to as the folded SFS.

Alternatively, if we know some things about the genetic history of our study species, we might be able to divide Allele A and Allele B into derived or ancestral alleles. Since SNPs often occur as mutations at a single site in the DNA, one allele at the given site is the new mutation (the derived allele) whilst the other is the ‘original’ (the ancestral allele). Typically, we would use the derived allele frequency to construct the SFS, since under coalescent theory we’re trying to simulate that mutation event. An SFS made of the derived alleles only is also referred to as the unfolded SFS.

Applications of the SFS

How can we use the SFS? Well, it can moreorless be used as a summary of genetic variation for many types of coalescent-based analyses. This means we can make inferences of demographic history (see here for more detailed explanation of that) without simulating large and complex genetic sequences and instead use the SFS. Comparing our observed SFS to a simulated scenario of a bottleneck and comparing the expected SFS allows us to estimate the likelihood of that scenario.

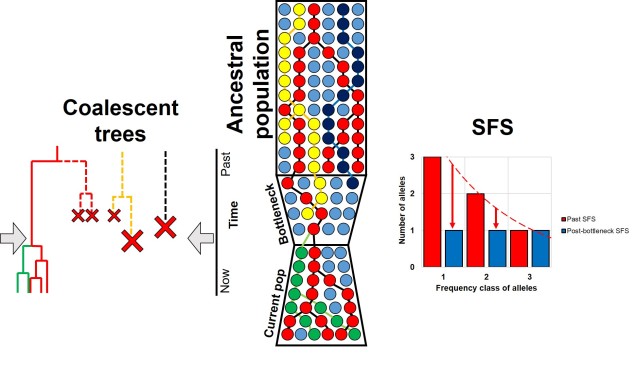
For example, we would predict that under a scenario of a recent genetic bottleneck in a population that alleles which are rare in the population will be disproportionately lost due to genetic drift. Because of this, the overall shape of the SFS will shift to the right dramatically, leaving a clear genetic signal of the bottleneck. This works under the same theoretical background as coalescent tests for bottlenecks.
SFS shift from bottleneck example.jpg
A representative example of how a bottleneck causes a shift in the SFS, based on a figure from a previous post on the coalescentCentre: the diagram of alleles through time, with rarer variants (yellow and navy) being lost during the bottleneck but more common variants surviving (red). Left: this trend is reflected in the coalescent trees for these alleles, with red crosses indicating the complete loss of that allele. Right: the SFS from before (in red) and after (in blue) the bottleneck event for the alleles depicted. Before the bottleneck, variants are spread in the usual exponential shape: afterwards, however, a disproportionate loss of the rarer variants causes the distribution to flatten. Typically, the SFS would be built from more alleles than shown here, and extend much further.

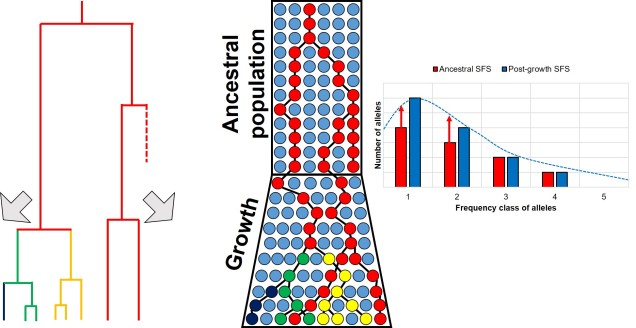
Contrastingly, a large or growing population will have a larger number of rare (i.e. unique) alleles from the sudden growth and increase in genetic variation. Thus, opposite to the bottleneck the SFS distribution will be biased towards the left end of the spectrum, with an excess of low-frequency variants.
SFS shift from expansion example.jpg
A similar diagram as above, but this time with an expansion event rather than a bottleneck. The expansion of the population, and subsequent increase in Ne, facilitates the mutation of new alleles from genetic drift (or reduced loss of alleles from drift), causing more new (and thus rare) alleles to appear. This is shown by both the coalescent tree (left) and a shift in the SFS (right).

The SFS can even be used to detect alleles under natural selection. For strongly selected parts of the genome, alleles should occur at either high (if positively selected) or low (if negatively selected) frequency, with a deficit of more intermediate frequencies.

Adding to the analytical toolbox

The SFS is just one of many tools we can use to investigate the demographic history of populations and species. Using a combination of genomic technologies, coalescent theory and more robust analytical methods, the SFS appears to be poised to tackle more nuanced and complex questions of the evolutionary history of life on Earth.

Mr. Gorbachev, tear down this (pay)wall

The dreaded paywall

For anyone who absorbs their news and media through the Internet (hello, welcome to the 21st Century), you would undoubtedly be familiar with a few frustrating and disingenuous aspects of media such as clickbait headlines and targeted advertising. Another one that might aggravate the common reader is Ol’ Reliable, the paywall – blocking access to an article unless some volume of money is transferred to the publisher, usually through a subscription basis. You might argue that this is a necessary evil, or that rewarding well-written pieces and informative journalism through monetary means might lead to the free market starving poor media (extremely optimistically). Or you might argue that the paywall is morally corrupt and greedy, and just another way to extort money out of hapless readers.

Paywalls.jpg
Yes, that is a literal paywall. And no, I don’t do subtlety.

Accessibility in science

I’m loathe to tell that you that even science, the powerhouse of objectivity with peer-review to increase accountability, is stifled by the weight of corporate greed. You may notice this from some big name journals, like Nature and Science – articles cost money to access, either at the individual level (e.g. per individual article, or as a subscription for a single person for a year) or for an entire institution (such as universities). To state that these paywalls are exorbitantly priced would be a tremendous understatement – for reference, an institution subscription to the single journal Nature (one of 2,512 journals listed under the conglomerate of Springer Nature) costs nearly $8,000 per year. A download of a single paper often costs around $30 for a curious reader.

Some myths about the publishing process

You might be under the impression, as above, that this money goes towards developing good science and providing a support network for sharing and distributing scientific research. I wish you were right. In his book ‘The Effective Scientist’, Professor Corey Bradshaw describes the academic publishing process as “knowledge slavery”, and no matter how long I spend thinking about this blog post would I ever come up with a more macabre yet apt description. And while I highly recommend his book for a number of reasons, his summary and interpretation of how publishing in science actually works (both the strengths and pitfalls) is highly informative and representative.

There are a number of different aspects about publishing in science that make it so toxic to researchers. For example, the entirety of the funds acquired from the publishing process goes to the publishing institution – none of it goes to the scientists that performed and wrote the work, none to the scientists who reviewed and critiqued the paper prior to publication, and none to the institutions who provided the resources to develop the science. In fact, the perception is that if you publish science in a journal, especially high-ranking ones, it should be an honour just to have your paper in that journal. You got into Nature – what more do you want?

Publishing cycle.jpg
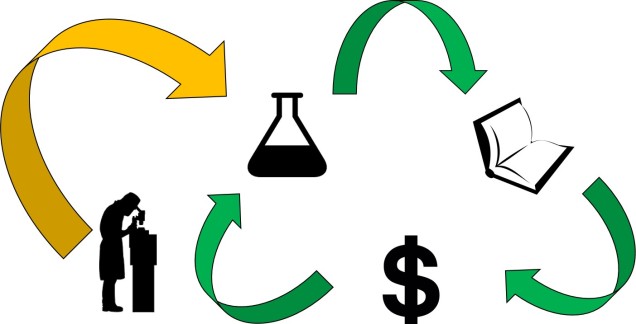
The alleged cycle of science. You do Good Science; said Good Science gets published in an equally Good Journal; the associated pay increase (not from the paper itself, of course, but by increasing success rates of grant applications and collaborations) helps to fund the next round of Good Science and the cost of publishing in a Good Journal. Unfortunately, and critically, the first step into the cycle (the yellow arrow) is remarkably difficult and acts as a barrier to many researchers (many of whom do Very Good Science).

Open Access journals

Thankfully, some journals exist which publish science without the paywall: we refer to these as ‘Open Access’ (OA) journals. Although the increased accessibility is undoubtedly a benefit for the spread of scientific knowledge, the reduced revenue often means that a successful submission comes with an associated cost. This cost is usually presented as an ‘article processing charge’: for a paper in a semi-decent journal, this can be upwards of thousands of dollars for a single paper. Submitting to an OA journal can be a bit of a delicate balance: the increased exposure, transparency and freedom to disseminate research is a definite positive for scientists, but the exorbitant costs that can be associated with OA journals can preclude less productive or financially robust labs from publishing in them (regardless of the quality of science produced).

Open access logo.png
The logo for Open Access journals, originally designed by PLoS.

Manuscripts and ArXives

There is somewhat of a counter culture to the rigorous tyranny of scientific journals: some sites exist where scientists can freely upload their manuscripts and articles without a paywall or submission cost. Naturally, the publishing industry reviles this and many of these are not strictly legal (since you effectively hand over almost all publishing rights to the journal at submission). The most notable of these is Sci-Hub, which uses various techniques (including shifting through different domain names in different countries) to bypass paywalls.

Other more user-generated options exist, such as the different subcategories of ArXiv, where users can upload their own manuscripts free of charge and without a paywall and predominantly prior to the peer-review process. By being publically uploaded, ArXiv sites allow scientists to broaden the peer-review process beyond a few journal-selected reviewers. There is still some screening process when submitting to ArXiv to filter out non-scientific articles, but the overall method is much more transparent and scientist-friendly than a typical publishing corporation. For articles that have already been published, other sites such as Researchgate often act as conduits for sharing research (either those obscured by paywalls, despite copyright issues, or those freely accessible by open access).

You might also have heard through the grapevine that “scientists are allowed to send you PDFs of their research if you email them.” This is a bit of a dubious copyright loophole: often, this is not strictly within the acceptable domain of publishing rights as the journal that has published this research maintains all copyrights to the work (clever). Out of protest, many scientists may send their research to interested parties, often with the caveat of not sharing it anywhere else or in manuscript form (as opposed to the finalised published article). Regardless, scientists are more than eager to share their research however they can.

Summary table.jpg
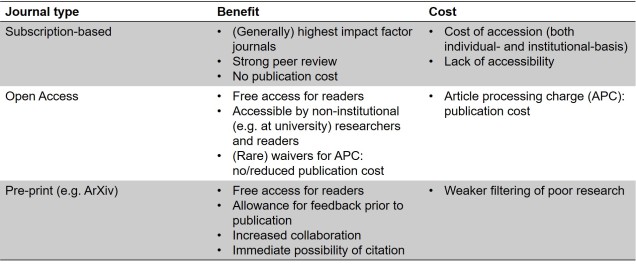
A summary of some of the benefits and detriments of each journal type. For articles published in pre-print sites there is still the intention of (at some date) publishing the article under one of the other two official journal models (and thereof are not mutually exclusive).

Civil rights and access to science

There are a number of both empirical and philosophical reasons why free access to science is critically important for all people. At least one of these (among many others) is based on your civil rights. Scientific research is incredibly expensive, and is often funded through a number of grants from various sources, among the most significant of which includes government-funded programs such as the Australian Research Council (ARC).

Where does this money come from? Well, indirectly, you (if you pay your taxes, anyway). While this connection can be at times frustrating for scientists – particularly if there is difficulty in communicating the importance of your research due to a lack of or not-readily-transparent commercial, technological or medical impact of the work – the logic applies to access to scientific data and results, too. As someone who has contributed monetarily to the formation and presentation of scientific work, it is your capitalist right to have access to the results of that work. Although privatisation ultimately overpowers this in the publishing world, there is (in my opinion) a strong moral philosophy behind demanding access to the results of the research you have helped to fund.

Walled off from research

Anyone who has attempted to publish in the scientific literature is undoubtedly keenly aware of the overt corruption and inadequacy of the system. Private businesses hold a monopoly on the dissemination of scientific research, and although science tries to overcome this process, it is a pervasive structure. However, some changes are in process which are seeking to re-invent the way we handle the publishing of scientific research and with strong support from the general public there is opportunity to minimise the damage that private publication businesses proliferate.