How can we predict which species will adapt to climate change?
Across the globe, threatened species are already becoming impacted by the effects of climate change. While we understand many of the characteristics that make a species particularly vulnerable to climate change – those with small ranges, fragmented populations, or long lifespans, for example – predicting the capacity of a given species to respond remains a challenge. Developing analytical approaches and science-based frameworks to predict adaptive capacity in all species is a critical step forward for conservation management.
A key approach – and one we’ve discussed on The G-CAT a few times before – is the notion of ‘genomic vulnerability’ or ‘genomic offset’. Popularised by a somewhat landmark paper on yellow warblers in Science by Bay et al. back in 2018, genomic vulnerability studies have seen a surge in recent years.
The premise is actually remarkably simple, as far as ecological genetics approaches go: first, we identify genetic variation within a species which is associated with existing (spatial) climatic gradients. Through statistical approaches such as genotype-environment associations or candidate gene studies, we can identify genetic variation putatively linked to climate (or other environmental characteristics) adaptation. By determining these relationships across current spatial variation, we can then use future projections of climate change to model how genetic variation within different parts of the species range (say, individual populations) is modelled to change in response (temporal variation). This gives us a relatively simple and intuitive statistic that measures the amount of genetic change a population must go through to keep up with climate change. By summarising these values across the candidate variants, we can estimate a ‘genomic vulnerability’ or ‘genomic offset’ score: populations with high values for these scores will require greater rates of adaptation (genetic change) to respond to local climate change. This is based on the intersection of two core components: local genetic variation, which underpins the adaptive capacity of the population, and local climate change, which determines the intensity of selection imposed on the population.

…But how do we validate our predictions?
As with many genomic approaches, validating the results with independent data (primarily demographic or fitness data) is key. In the Bay et al. 2018 paper, for example, they demonstrated that populations identified as being most vulnerable to climate change (i.e., with high genomic vulnerability scores) were already showing significant demographic declines relative to those with lower scores. The authors suggest that this is indicative of climate impacts already occurring at the local scale and may demonstrate further effects into the future.
But this type of “ground-truthing” is rare, and often difficult to implement, forming a consistent criticism of many adaptive genomics studies. Particularly, it is exceedingly difficult to truly validate candidate adaptive loci: in an ideal world, we would be able to demonstrate not only the link between genetic variation and the environment (which could, realistically, involve many not-truly-adaptive associations), but the full sequence of connections between genotype, phenotype (physical characteristics), environment and fitness. In a perfect system, this would allow us to confidently assert not only the adaptive value of the putative loci, but their physiological effects, contribution to fitness (the core component of evolution) and the environmental conditions that imposed that adaptation. In most cases, however, we can’t be certain of the ecological function of many variants, even if we can identify the specific gene it occurs within. Based on these limitations – and others, around potential missing information in understanding the process of adaptation – there has been significant debate around the value of adaptive genomics for active conservation management. Some argue that it’s a crucial part of conservation frameworks and needs to be valued as a separate entity to broad-scale genetic diversity metrics: others argue that the field may not be mature enough to robustly inform management actions, or that non-adaptive variation provides just as much information for decision-making. Regardless, some reservations around the suitability of adaptive genomics remains.
The tale of the willow flycatcher
These developments bring us to my favourite read this year – another key adaptive genomics and genomic vulnerability of a threatened bird (including many of the Bay et al. 2018 authors, in fact). The model species in this case is the willow flycatcher – a small migratory bird endemic to North America. Although widespread, the willow flycatcher species is comprised of four different subspecies and is classified as Endangered in the US due to ongoing population declines driven by habitat loss. Previous work indicated that subspecies in the southwest (around California) was likely to be most vulnerable to climate change: the aforementioned study aimed to better clarify the adaptive potential of this subspecies to climate change.

To explore this question, Turbek et al. sequenced whole genomes for 234 flycatchers across the US, obtained from previous studies and field collections from 1996 through to 2015. Seventeen of these were obtained through historical specimens from San Diego, which were originally collected from 1888 to 1909: these represent a very important contribution to the study by providing a historical baseline for many of the analyses conducted. As whole genome sequencing is expensive and requires quite extensive (and high quality) DNA, they complemented this dataset using a targeted SNP genotyping approach, focusing on 96 specific regions of the genome previously identified as being informative for population assignment. This approach added 366 more flycatchers to the data (and some overlap with the whole genome data) collected from 1901 to 1958. Together, these genomic datasets provide a comprehensive spatial and temporal overview of the genetic diversity and changes in the species, allowing them to investigate multiple components of evolutionary change.

The authors analysed how population structure across the willow flycatcher range had shifted over the last century; identified genomic regions associated with introgression; performed genotype-environment association (GEA) analysis and identified candidate climate-linked loci. Together, these approaches describe how genetic changes – related to both genetic drift and adaptation – have shaped the evolution of flycatchers over the last century. But it’s one particular extension of the last method which is the most interesting. Based on the results from a GEA, we can predict the association of the frequency of putatively adaptive variants and environmental (in this case, climatic) variables. This becomes a core basis for genomic vulnerability, by predicting how much adaptive allele frequency change a population is predicted to need in the future to maintain its position within the GEA (i.e., the corresponding genetic change to keep up with environmental change). But what if we looked…backwards, instead?
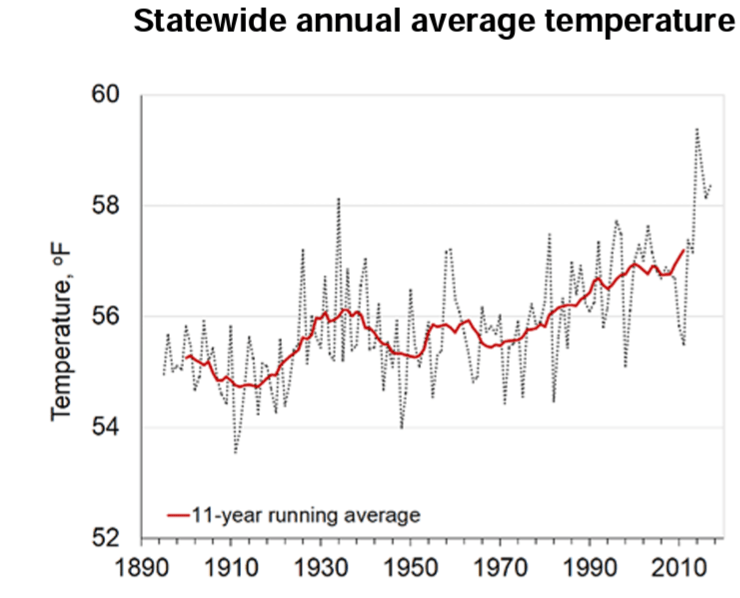
Well, having the historical museum data allowed Turbek et al. to do exactly that! Historical climate records show how extensive climate change has already been in the San Francisco area, with an increase of ~1.4°C mean temperature since the late 1800s. If these GEA relationships are accurate – and thus, suitable for predicting genomic vulnerability – then we would predict that the Californian population would already have experienced an associated genetic shift. By using their historical samples, known past climate changes and their GEA model, the authors found that around 70% of their candidate adaptive loci did show the predicted changes over the last century. This provides stronger evidence for climate-driven adaptation in willow flycatchers and gives us more confidence in the ability to predict genomic vulnerability for this species.

The value of validating vulnerability assessments
While genomic vulnerability offers a promising approach to explore adaptive resilience – especially in threatened and declining species – the methodology is still relatively young, leading to hesitant implementation. Given our oft-limited understanding of the complex mechanisms underlying adaptation, species biology and interactive effects, linking genomic vulnerability predictions to other data types is critical. Early adopters of the approach have correlated predictions with observed impacts of demographic decline; others, when data allows, have directly related genomic vulnerability with known fitness impacts. With these more integrative and holistic frameworks, we can start to ground-truth predictions of genomic vulnerability to better inform conservation management actions.

At the same time, the historical approach used in Turbek et al. 2023 highlights another key research field: museomics. Museums are important cradles of biological knowledge across the globe, extensively documenting the distribution and change in biodiversity over eons. With ongoing technological developments – whole genomes have been sequenced from woolly mammoth teeth nearly 1.6 million years old! – our capacity to understand evolutionary patterns and processes (especially in response to past, present, and future environmental change) will only expand. While you may think of museums as just a public library of knowledge and history, these important institutions also play a critical role in many aspects of cutting-edge research. You might be surprised by just how much research is done by, or because of, museums: I (emphatically!) suggest you visit and support your local museums!
