The site-frequency spectrum
In order to simplify our absolutely massive genomic datasets down to something more computationally feasible for modelling techniques, we often reduce it to some form of summary statistic. These are various aspects of the genomic data that can summarise the variation or distribution of alleles within the dataset without requiring the entire genetic sequence of all of our samples.
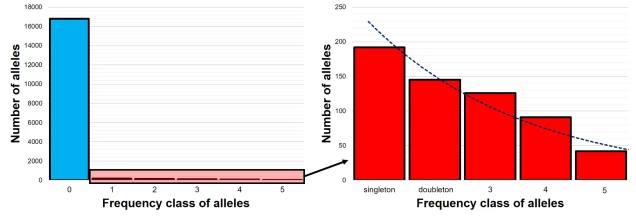
One very effective summary statistic that we might choose to use is the site-frequency spectrum (aka the allele frequency spectrum). Not to be confused with other measures of allele frequency which we’ve discussed before (like Fst), the site-frequency spectrum (abbreviated to SFS) is essentially a histogram of how frequent certain alleles are within our dataset. To do this, the SFS classifies each allele into a certain category based on how common it is, tallying up the number of alleles that occur at that frequency. The total number of categories would be the maximum number of possible alleles: for organisms with two copies of every chromosome (‘diploids’, including humans), this means that there are double the number of samples included. For example, a dataset comprised of genomic sequence for 5 people would have 10 different frequency bins.
For one population
The SFS for a single population – called the 1-dimensional SFS – this is very easy to visualise as a concept. In essence, it’s just a frequency distribution of all the alleles within our dataset. Generally, the distribution follows an exponential shape, with many more rare (e.g. ‘singletons’) alleles than there are common ones. However, the exact shape of the SFS is determined by the history of the population, and like other analyses under coalescent theory we can use our understanding of the interaction between demographic history and current genetic variation to study past events.
Expanding the SFS to multiple populations
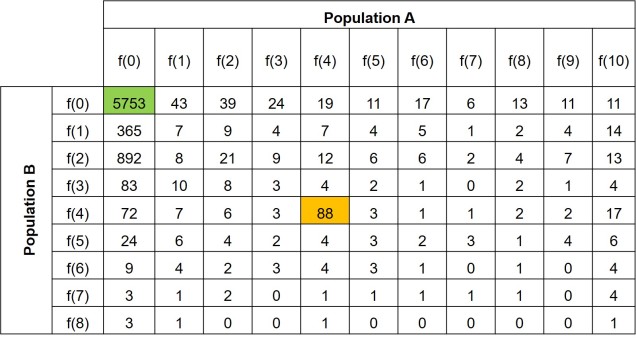
Further to this, we can expand the site-frequency spectrum to compare across populations. Instead of having a simple 1-dimensional frequency distribution, for a pair of populations we can have a grid. This grid specifies how often a particular allele occurs at a certain frequency in Population A and at a different frequency in Population B. This can also be visualised quite easily, albeit as a heatmap instead. We refer to this as the 2-dimensional SFS (2DSFS).
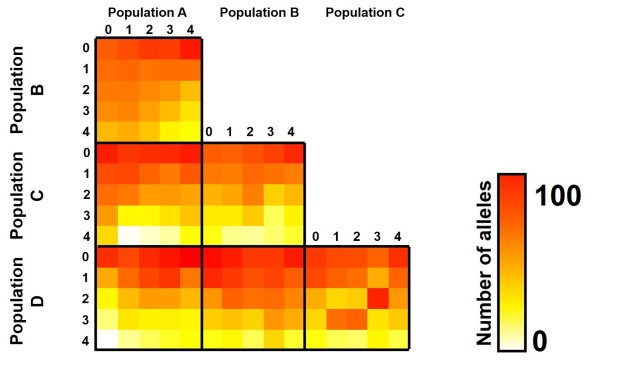
The same concept can be expanded to even more populations, although this gets harder to represent visually. Essentially, we end up with a set of different matrices which describe the frequency of certain alleles across all of our populations, merging them together into the joint SFS. For example, a joint SFS of 4 populations would consist of 6 (4 x 4 total comparisons – 4 self-comparisons, then halved to remove duplicate comparisons) 2D SFSs all combined together. To make sense of this, check out the diagrammatic tables below.

The different forms of the SFS
Which alleles we choose to use within our SFS is particularly important. If we don’t have a lot of information about the genomics or evolutionary history of our study species, we might choose to use the minor allele frequency (MAF). Given that SNPs tend to be biallelic, for any given locus we could have Allele A or Allele B. The MAF chooses the least frequent of these two within the dataset and uses that in the summary SFS: since the other allele’s frequency would just be 2N – the frequency of the other allele, it’s not included in the summary. An SFS made of the MAF is also referred to as the folded SFS.
Alternatively, if we know some things about the genetic history of our study species, we might be able to divide Allele A and Allele B into derived or ancestral alleles. Since SNPs often occur as mutations at a single site in the DNA, one allele at the given site is the new mutation (the derived allele) whilst the other is the ‘original’ (the ancestral allele). Typically, we would use the derived allele frequency to construct the SFS, since under coalescent theory we’re trying to simulate that mutation event. An SFS made of the derived alleles only is also referred to as the unfolded SFS.
Applications of the SFS
How can we use the SFS? Well, it can moreorless be used as a summary of genetic variation for many types of coalescent-based analyses. This means we can make inferences of demographic history (see here for more detailed explanation of that) without simulating large and complex genetic sequences and instead use the SFS. Comparing our observed SFS to a simulated scenario of a bottleneck and comparing the expected SFS allows us to estimate the likelihood of that scenario.
For example, we would predict that under a scenario of a recent genetic bottleneck in a population that alleles which are rare in the population will be disproportionately lost due to genetic drift. Because of this, the overall shape of the SFS will shift to the right dramatically, leaving a clear genetic signal of the bottleneck. This works under the same theoretical background as coalescent tests for bottlenecks.
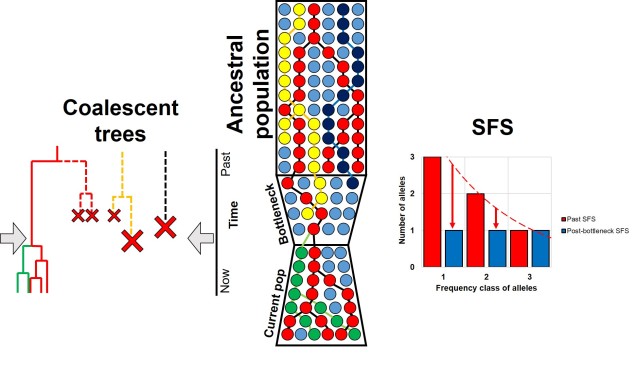
Contrastingly, a large or growing population will have a larger number of rare (i.e. unique) alleles from the sudden growth and increase in genetic variation. Thus, opposite to the bottleneck the SFS distribution will be biased towards the left end of the spectrum, with an excess of low-frequency variants.
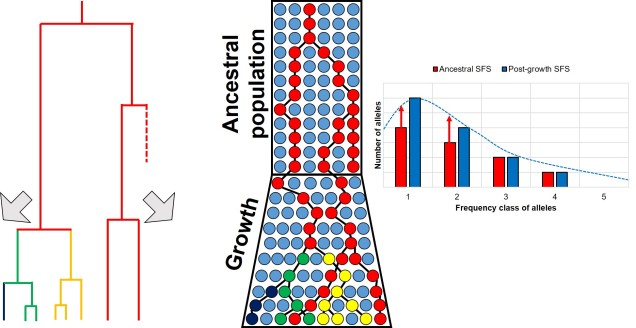
The SFS can even be used to detect alleles under natural selection. For strongly selected parts of the genome, alleles should occur at either high (if positively selected) or low (if negatively selected) frequency, with a deficit of more intermediate frequencies.
Adding to the analytical toolbox
The SFS is just one of many tools we can use to investigate the demographic history of populations and species. Using a combination of genomic technologies, coalescent theory and more robust analytical methods, the SFS appears to be poised to tackle more nuanced and complex questions of the evolutionary history of life on Earth.

3 thoughts on “The ‘other’ allele frequency: applications of the site frequency spectrum”