Reconstructing evolutionary history
Unravelling the evolutionary history of organisms – one of the main goals of phylogenetic research – remains a challenging prospect due to a number of theoretical and analytical aspects. Particularly, trying to reconstruct evolutionary patterns based on current genetic data (the most common way phylogenetic trees are estimated) is prone to the erroneous influence of some secondary factors. One of these is referred to as ‘incomplete lineage sorting’, which can have a major effect on how phylogenetic relationships are estimated and the statistical confidence we may have around these patterns. Today, we’re going to take a look at incomplete lineage sorting (shortened to ILS for brevity herein) using a game-based analogy – a Pachinko machine. Or, if you’d rather, the same general analogy also works for those creepy clown carnival games, but I prefer the less frightening alternative.
The Pachinko machine of evolution
In this analogy, we have an initial population (top) containing a number of coloured marbles. Each marble represents a single genetic variant, with its colour denoting one of two different alleles. (You can choose to think of each marble as an individual fish/bird/person/whatever, but it makes the analogy a little confusing when we add the time component). The total number of marbles can therefore be seen as a proxy of the ancestral population size (through genetic diversity).
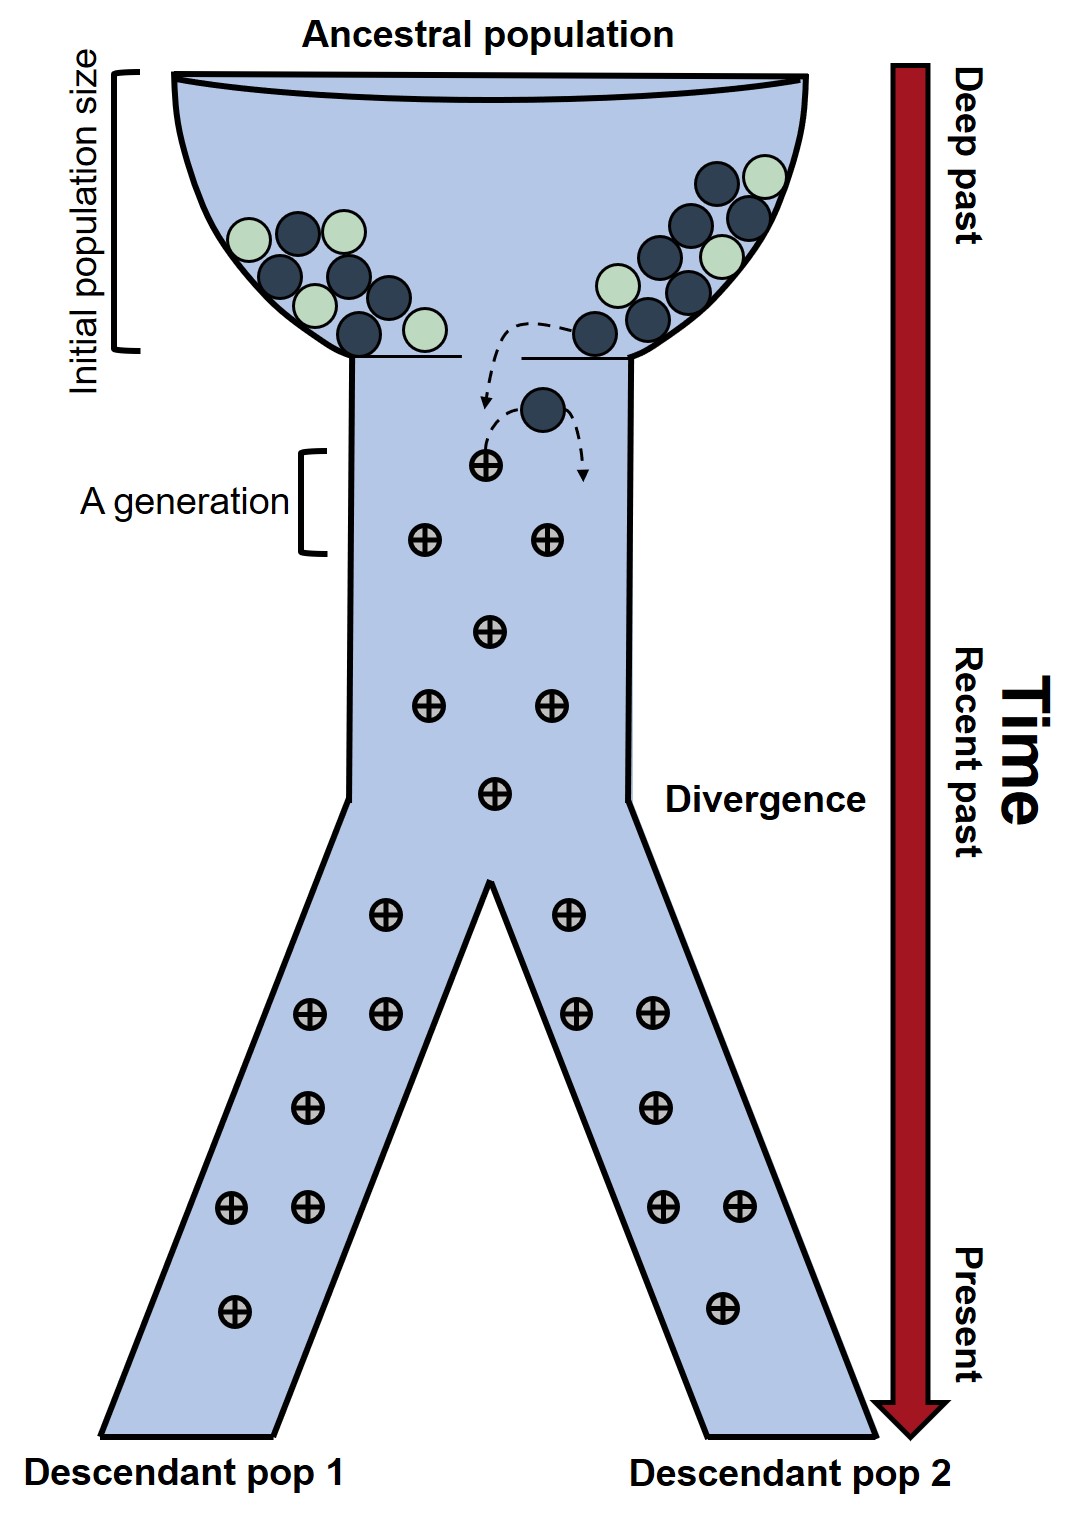
Each of these marbles is then passed down onto future generations through inheritance based on random genetic drift. If this part of the figure seems familiar, it’s because its basically a glamorised version of the standard representation of the coalescent. (Within the main body of the machine, you can think of each row of pins [the bouncing points] as the separation of each generation). Over time, these alleles are thus randomly passed down through the population following the standard dynamics of genetic drift (that is, random inheritance). However, a ‘crisis of faith’ occurs when, eventually, this single population is split into two descendant lineages. Now each allele has a particular (random) ‘decision’ to make – to be passed on to Pop1 or Pop2. Again, we are assuming this pattern is moreorless random (and not affected by natural selection). This ‘decision’ is repeated for all the alleles in the population (and across many more markers, not just one as depicted here).
Of course, when we reconstruct evolutionary histories we often can only see where the marbles ended up, not the path that they took to get there. Determining the most statistically probable path is thus the main goal of phylogenetic approaches. This is primarily done by looking at the diversity or frequency of genetic variants in our descendant populations and connecting them back in time based on which ones most likely shared a common ancestor more recently.
Complete lineage sorting as an example
Before we can adequately dive into ILS itself, it might be helpful to provide an example of complete lineage sorting as a reference. For this, we’re going to need at least three descendant populations to be able to demonstrate the sorting. In this circumstance, we are taking our collection of three individuals per population in the current populations (at the bottom) and trying to reconstruct their ‘paths’ through the Pachinko. Since Pop 2 and Pop 3 both only contain blue marbles, it makes since that they share a common ancestor relatively recently – you’ll see that this is the result of an ancient mutation which these two lineages share (but Pop 1 does not). Based on this one locus (remember that this would ordinarily be repeated for hundreds or thousands of individual loci), our reconstruction of the tree (the black lines that follow their trajectories) closely match the overall patterns of evolutionary history (the constraining blue boxes). That is, Pop 2 and Pop 3 diverged relatively recently from one another and Pop 1 is a more ancient and divergent lineage.
Under complete lineage sorting, we can very easily determine the evolutionary history of our populations – the contemporary genetic diversity is a perfect mirror of the evolutionary process that have given rise to them. However, this is (quite often) not the case – which is where incomplete lineage sorting becomes an issue.
Incomplete lineage sorting
ILS occurs when contemporary populations share genetic diversity that, when analysed using phylogenetic approaches, results in incorrect reconstructions of history. Specifically, ILS relates to how ancestral genetic variation – and the way it is sorted into descendant lineages – might influence patterns of genetic diversity in those populations. This can happen when individuals within one population share more alleles with those in another population than other members of their own population. How these alleles are retained or lost over time dictates which population they end up in (and the paths leading between them).

In the above example, you can see how some individuals in different populations appear more closely related by evolutionary history than to other individuals in their same population. This happens because the ancestral population contains both the blue and green alleles which are randomly sorted into all three descendant populations. Thus, some individuals in Pop 1, 2 and 3 retained the green allele (and thus share a more recent ancestor) compared to others with the blue allele. Of course, sampling many more loci per individual may help to clarify the overarching evolutionary history if we expect more to behave according to their evolutionary trajectories than to contradict it (e.g. ILS).
How prolific is ILS?
ILS frequently means that a number of loci within a particular dataset are misleading about the evolutionary history that have given rise to them – in fact, in some cases, ILS can be so prolific that loci are more often ‘wrong’ about the patterns that caused them than right. Because of this, we might have very strong statistical support for a phylogenetic tree which is not actually reflective of the true history of lineages. Some groups, such as some birds, have phylogenetic histories which are particularly difficult to unravel thanks to ILS. With that in mind, what factors make ILS such a problem for phylogenies?
Factors affecting ILS
Ancestral population size
As you might expect, the overall size (and genetic diversity) of the ancestral population can have a large impact on the proliferation of ILS in the descendant lineages. Given that there is a time lag for genetic drift to remove some genetic diversity in the descendants, or for new unique mutations to appear in the descendants, higher levels of genetic diversity in the ancestor might make ‘sorting’ of alleles more challenging.
Branching times
Relatedly, the time between divergence events (especially when there are many clustered together) may also influence ILS. If not enough (evolutionary) time is allowed for alleles to drift and sort between lineages, they are much more likely to be ‘shuffled’ around randomly. Descendant lineages will thus maintain an array of genetic diversity that is shared with some (related) lineages, some that is maintained from the distant ancestor, and others which have (by chance) been shuffled into another lineage despite not being closely related. This results in an almost ‘cloud’ of divergence events which are difficult to sort between, causing phylogenetic trees with many short internal branches to be statistically difficult to resolve.
The above example is derived from my own PhD work, using populations that were once likely a well-connected metapopulation but were relatively recently fragmented into separate (very isolated) populations. The coloured circles demonstrate the statistical support for the given node of the tree (blue ones are more supported than red ones) based on ~45,000 loci (SNPs). Black squares represent the contemporary samples (tips). The red highlight box indicates The Danger Zone of ILS – the series of short successive branches make it hard to determine the ‘true’ evolutionary patterns in this part of the tree, leading to less supported nodes. Of course, there is some variation in support across the tree generally, but this cluster of low support is likely driven by the influence of ILS.
Post-divergence gene flow
Although considered a separate issue to ILS, gene flow between the descendant lineages (after their initial divergence) can produce a similar genetic signal to ILS. This is because alleles which might be unique to one lineage can become transferred to another in a way that contradicts the typical flow of alleles over time. For example, gene flow between the two most divergent lineages in the above set of three may make them look more closely related than lineages which actually are closely related (by evolutionary descent). Distinguishing between ILS and post-divergence gene flow is challenging, but there a number of statistical approaches (such as D-statistics) which tackle this quite well.
Concluding remarks
ILS is a major factor influencing our reconstructions of the tree of life. Understanding how it occurs, how it alters our estimations of evolutionary history, and how best to account for it in future reconstructions is an important component of phylogenetic research. For those looking to understand ILS a little better – as well as a number of other theoretical and technical challenges in current phylogenetic research – I highly recommend diving into ‘Phylogenetics in the Genomic Era‘ by Celine Scornavacca, Frédéric Delsuc and Nicolas Galtier (published in 2020). It’s a great book and is freely available in PDF format here.

One thought on “Incomplete lineage sorting through Pachinko – a visual analogy”