“How do you conserve genes?”: clarifying conservation genetics

Sometimes when I talk about the concept of conservation genetics to friends and family outside of the field, there can be some confusion about what this actually means. Usually, it’s assumed that means the conservation of genetics: that is, instead of trying to conserve individual animals or plants, we try to conserve specific genes. While in some cases this is partially true (there might be genes of particular interest that we want to maintain in a wild population), often what we actually mean is using genetic information to inform conservation management and to give us the best chance of long-term rescue for endangered species.

DNA Zoo comic
Don’t worry, it’s an open range zoo: the genes have plenty of room to roam.

See, the DNA of individuals contains much more information than just the genes that make up an organism. By looking at the number, frequency or distribution of changes and differences in DNA across individuals, populations or species, we can see a variety of different patterns. Typically, genetics-based conservation analysis is based on a single unifying concept: that different forces create different patterns in the genetic make-up of species and populations, and that these can be statistically evaluated using genetic data. The exact type or scale of effect depends on how the data is collected and what analysis we use to evaluate that data, although we could do multiple types of analysis using the same dataset.

Oftentimes, we want to know about the current or historical state of a species or population to best understand how to move forward: by understanding where a species has come from, what it has been affected by, and how it has responded to different pressures, we can start to suggest and best manage these species into the future.

However, there are lots of possible avenues for exploration: here are just a few…

Evolutionary significant units (ESUs) and management units (MUs)

One commonly used application of genetic information for conservation is the designation of what we call ‘Evolutionary Significant Units’ (ESUs). Using genetics, we can determine the boundaries of particular populations which correspond to their own unique evolutionary groups. These are often the results of historical processes which have separated and driven the independent evolution of each ESU, usually with low or no gene flow across these units. Generally, managing and conserving each of these can lead to overall more robust management of the species as a whole by making sure certain groups that have unique and potentially critical adaptations are maintained in the wild. Although ESUs can sometimes be arguable (particularly when there is some, but not much, gene flow across units), it forms an important aspect of conservation designations.

In cases of shorter term separations across these populations, where there are noticeable differences in the genetics of the populations but not necessarily massively different evolutionary histories, conservationists will sometimes refer to ‘Management Units’ (MUs). These have much weaker evolutionary pressure behind them but might be indicative of very recent impacts, such as human-driven fragmentation of habitat or contemporary climate change. MUs often reflect very sudden and recent changes in populations and might have profound implications for the future of these groups: thus, they are an important way of assessing the current state of the species. The next couple of figures demonstrate this from one of my colleagues’ research papers.

YPP_map
The geographic distributions of Yarra pygmy perch populations, generously taken from Brauer et al. (2013). Each dot and number on the map represents a single population of pygmy perch used in the analysis. The colour of the population represents which MU it belongs to, whilst the shape of the marker represents the ESU. To make this easier to visualise, the solid lines indicate the boundaries of ESUs while the dashed lines represent MU boundaries. You’ll notice that MUs are subsets of ESUs, and that Population 6 actually fits into two different ESUs: see below.
YPP_Structure
An example of the output of an analysis (STRUCTURE) that determines population boundaries for Yarra pygmy perch using genetic data, generously taken from Brauer et al. (2013). Structure is an ‘assignment test’; using the input genetic information, it tries to make groups of individuals which are more similar to one another than other groups. In the graphs, each small column represents a single individual, with the colour bars representing how well it fits that (colour) population. The smaller numbers at the bottom and the labels above the graphs represent geographic populations (see the figure above). A) Shows the 4 major ESUs of Yarra pygmy perch, with some clear mixing between the Eastern ESU and the Merri/Curdies ESU in population 6. The rest of the populations fit pretty well entirely into one ESU. B) The MUs of Yarra pygmy perch, which shows the genetic structure within ESUs that can’t be seen well in A). Notice that some ESUs are made of many MUs (E.g. Central) while others are only one MU (e.g. MDB).

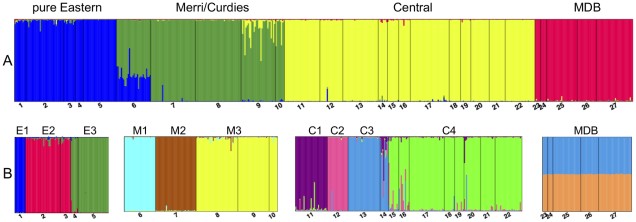
The two can be thought of as part of the same hierarchy, with ESUs reflecting more historic, evolutionary groups and MUs reflecting more recent (but not necessarily evolutionary) groups. For conservation management, this has traditionally meant that individuals from one ESU were managed independent of one another (to preserve their ‘pure’ evolutionary history) whilst translocations of individuals across MUs were common and often recommended. This is based on the idea that mixing very genetically different populations could cause adaptive genes in each population to become ‘diluted’, negatively affecting the ability of the populations to evolve: this is referred to as ‘outbreeding depression’ (OD).

Coffee comic
Sometimes, adding something can make what you had even worse than before. The most depressing analogy of outbreeding depression; a ruined coffee.

However, more recent research has suggested that the concerns with OD from mixing across ESUs are less problematic than previously thought. Analysis of the effect of OD versus not supplementing populations with more genetic diversity has shown that OD is not the more dangerous option, and there is a current paradigm push to acknowledge the importance of mixing ESUs where needed.

Adaptive potential and future evolution

Understanding the genetic basis of evolution also forms an important research area for conservation management. This is particularly relevant for ‘adaptive potential’: that is, the ability for a particular species or population to be able to adapt to a variety of future stressors based on their current state. It is generally understood that having lots of different variants (alleles) of genes in the total population or species is a critical part of evolution: the more variants there are, the more choices there are for natural selection to act upon.

We can estimate this from the amount of genetic diversity within the population, as well as by trying to understand their previous experiences with adaptation and evolution. For example, it is predicted that species which occur in much more climatically variable habitats (such as in desert regions) are more likely to be able to handle and tolerate future climate change scenarios since they’ve demonstrated the ability to adapt to new, more extreme environments before. Examples of this include the Australian rainbowfishes, which are found in pretty well every climatic region across the continent (and therefore must be very good at adapting to new, varying habitats!).

Rainbowfish both.jpg
Left: The distribution of rainbowfish across Australia, with each colour representing a particular ecotypeRight: A photo of a (very big) tropical rainbowfish taken from a recent MELFU field trip. Source: MELFU Facebook page. He really got around after that one stint in that children’s story.

Genetics-based breeding programs and pedigrees

A much more direct use of genetic information for conservation is in designing breeding programs. We know that breeding related individuals can have very bad results for offspring (this is referred to as ‘inbreeding depression’): so obviously, we would avoid breeding siblings together. However, in complex breeding systems (such as polygamous animals), or in wild populations, it can be very difficult to evaluate relationships and overall relatedness.

That’s where genetics comes in: by looking at how similar or different the DNA of two individuals are, we can not only check what relationship they are (e.g. siblings, cousins, or very distantly related) but also get an exact value of their genetic relatedness. Since we know that having a diverse gene pool is critical for future adaptation and survival of a species, genetics-based breeding programs can maximise the amount of genetic diversity in following generations. We can even use a computer algorithm to make the very best of breeding groups, using a quirky program called SWINGER.

Cats DNA dating
If You Are the One, conservation genetics edition.

Taxonomy for conservation legislation

Another (slightly more complicated) application of genetics is the designation of species status. Large amounts of genetic information can often clarify complex issues of species descriptions (later issues of The G-CAT will discuss exactly how this works and why it’s not so straightforward…).

Why should we care what we call a species or not? Well, much of the protective legislation at the government level is designed at the species-level: legislative protections are often designated for a particular species, but doesn’t often distinguish particular populations. Thus, misidentified species can sometimes but lost if they were never detected as a unique species (and assumed to be just a population of another species). Alternatively, managing two species as one based on misidentification could mess with the evolutionary pathways of both by creating unfit hybrid species which do not naturally come into contact together (say, breeding individuals from one species with another because we thought they were the same species).

Cryptic cats comic
Awkward.

Additionally, if we assume that multiple different species are actually only one species, this can provide an overestimate of how well that species is doing. Although in total it might look like there are plenty of individuals of the species around, if this was actually made of 4 separate species then each one would be doing ¼ as well as we thought. This can feed back into endangered status classification and thus conservation management.


These are just some of the most common examples of applied genetics in conservation management. No doubt going into the future more innovative and creative methods of applying genetic information to maintaining threatened species and populations will become apparent. It’s an exciting time to be in the field and inspires hope that we may be able to save species before they disappear from the planet permanently.

‘The Building Block of Life’

Before we can delve too deep into the expansive world of molecular ecology (that is, the study of evolution using genetic information), we must first understand the basics of genetics.

All organisms (except some viruses, if you count those) contain DNA: you may have heard it referred to as ‘the building block of life’. And this is fundamentally true; DNA is a chemical compound contained within cells which acts as a technical blueprint the cell will use to make all of the parts of the body. In its stable state, DNA looks like a ‘twisted ladder’, or a ‘double helix’ as we call it. The rungs of the DNA ladder are made of a combination of ‘nucleotide bases’, which are shortened to G (guanine), C (cytosine), A (adenosine) and T (thymine). Hopefully, these letters look a little familiar (see the top of the page…). Each one of these is always paired with a specific base: A is always paired with T, G with C. One ‘pair’ of sequences makes up one rung of the ladder.

DNA structure
The (very simplified) structure of the DNA double helix. Bonus points if you spot the blog title.

These letters of the DNA more-or-less spell out the basis for making all of the different proteins of the body. Specific sequences will say, for example, where to start reading the code (the capital at the start of the sentence) for a particular protein, while others will tell it where to stop (the full stop at the end of the sentence). The rest of the sentence is translated into the protein and is what we call a ‘gene’.

Despite the importance of genes, not all of the DNA is actually made of them. In fact, it’s estimated that only 1.5% of the genome (that is, the collection of all the DNA sequence in an organism) consists of genes: the rest of it is attributed to other things like control sequences, ‘junk’ DNA or coding for non-proteins (like RNAs, another type of nucleic acid). Some sections of the DNA sequence are often ‘cut out’ during the process of translating the gene into a protein; these are call ‘introns’ and are considered non-coding regions. It’s sort of like when you’re 100 words over the word count of an essay and have to start chopping sentences into smaller pieces. The parts that aren’t cut out, and actually translate to the protein, are called ‘exons’.

While the exact code of the gene is important, not all genes are expressed at the same time or constantly. Many genes are ‘switched on’ (activated) or ‘switched off’ (deactivated) by other external influences; usually different micro-sequences or proteins which block off or allow the translation process to occur. For example, the gene that creates the protein to digest lactose isn’t always active: only when lactose enters the cell and binds to a specific protein that rests on top of the lactose-digesting gene, removing it, does translation start to happen. This is because it’d be a total waste to make lactose-digesting proteins if there was no lactose around at all.

Genome structure
The generalised structure of the genome. Note that much of it is not made of genes. Within the gene, only the exon regions are translated into the final protein; the intron sequences are removed in an intermediate copy of the DNA (call the ‘mRNA’). The expression of the gene is controlled by the presence or absence of the repressor protein.

Why does all of this matter for molecular ecology? Well, the DNA sequence changes over generations due to mutations (spoiler: they don’t usually turn your skin green); these can happen for a variety of different reasons and aren’t inherently good or bad. It really depends where these mutations are happening in the genome and how this changes the DNA and the downstream proteins (or not).

Thus, DNA evolves over time if new mutations arise which cause changes that natural selection favours: if a mutation makes an animal see better at night, then it might gradually evolve to become a night hunter as it accumulates new mutations (if there is an actual fitness benefit to doing so: we’ll discuss that more in a later post). Contrastingly, bad mutations which cause an organism to be very “maladaptive” (i.e. “bad”; say, mutations which make your eyes bleed constantly) would be selected against.

We can use these types of information to study the evolution, ecology and conservation status of a species or population. We can look at how these mutations have accumulated; where in the genome they have accumulated; how frequently these new mutations arise; what effect these mutations have on the organism. With different statistical models, we can start to build a quantifiable way to handle this data and voila: molecular ecology is born! Many of these models are based on mathematical correlations between certain patterns in the frequency and distribution of new mutations within populations or species and certain biological effects like the size of the population, natural selection or connectivity across populations. Thus, we can investigate a massive swathe of possible questions with genetic data!

Welcome to The G-CAT!

Hi all! Welcome to The Genetics Cat, or The G-CAT for short! This blog was initially started as a way for me to not only practice writing and communicating science to the general public, but also as an avenue for me to share scientific research that I’m interested in to a broader community. As one might expect, this blog will predominantly feature discussions of evolution, ecology and genetics in a (hopefully) digestible manner. I will try to keep the topics broad to encompass a range of interests, but I undoubtedly have a bias towards conservation and evolutionary genetics…that said, if you have suggestions for content you’d like to see, please request away! I will try my absolute best to facilitate them!

You may be shocked to discover that this blog is, in fact, not written by a cat. In fact, I don’t even study cats. I’m sorry to burst that bubble for you. My real name is Sean Buckley, and I’m a PhD student within the Molecular Ecology Lab of Flinders University (MELFU) in Adelaide, South Australia. My research involves using large-scale genetic data to investigate the evolutionary history of a group of rather cute, and very endangered, small endemic freshwater fish known as the pygmy perches.

Yarra pygmy perch
One of the charismatic critters I work with! This is a Yarra pygmy perch, who is currently a founder of a genetics-based captive breeding program for a population that is now extinct in the wild.

Specifically, my research aims to use genomic data and complex statistical modelling to see how some species of pygmy perches have changed over time. Particularly, I will look at how their population sizes, genetic connectivity and distributions have changed throughout history, and how these relate to changes in the climate, geology and hydrology of their habitats. My research will help to address historical patterns of genetic diversity and evolution in freshwater organisms across Australia, as well as inform conservation management of modern pygmy perches.

Prior to my PhD, I also did an Honours thesis on a similar topic, but focusing on the broad evolutionary (phylogenetic) relationships of pygmy perches. These patterns were related to historic environmental factors across the continent of Australia. Furthermore, through my Honours research, I discovered that one species of pygmy perch is actually three genetically distinct but physically indistinguishable species! My PhD will expand on these to (hopefully) start to suggest some of the environmental and spatial factors that may have influenced this previously hidden diversity of species.

Without further ado, welcome to The G-CAT!