The changing world
Climate change seems to be the centrefold of a large amount of scientific research and media attention, and rightly so: it has the capacity to affect every living organism on the planet. It’s our duty as curators and residents of Earth to be responsible for our influences on the global environmental stage. While a significant part of this involves determining causes and solutions to our contributions to climate change, we also need to know how extensive the effects will be: for example, how can we predict how well species will do in the future?
Predicting the effect of climate change on all of the world’s biodiversity is an immense task. Climate change itself is a complicated system, and causes diverse, interconnected and complex alterations to both global and local climate. Adding on top of this, though, is that climate affects different species in different ways; where some species might be sensitive to some climatic variables (such as rainfall, available sunlight, seasonality), others may be more tolerant to the same factors. But all living things share some requirements, so surely there must be some consistency in their responses to climate change, right?

How predictable are species responses to climate change?
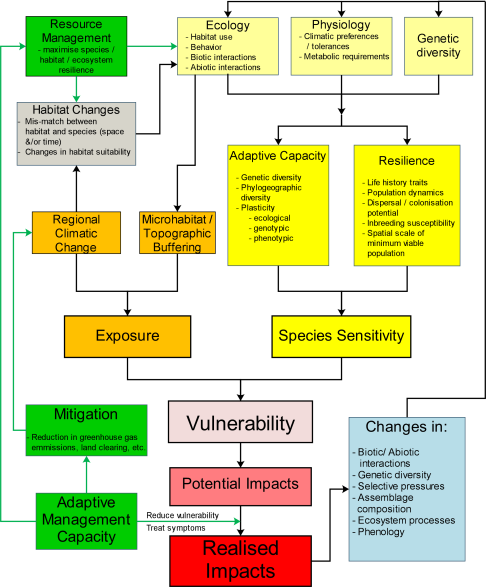
Well, evidence would surprisingly suggest not. Many species, even closely related ones, can show very different responses to the exact same climatic pressures or biogeographical events. There are a number of different traits that might affect a species’ ability to adapt, particularly their adaptive genetic diversity (which underpins ‘adaptive potential’). Thus, we need good information of a variety of genetic, physiological and life history traits to be able to make predictions about how likely a species is to adapt and respond to future (and current) climate changes.
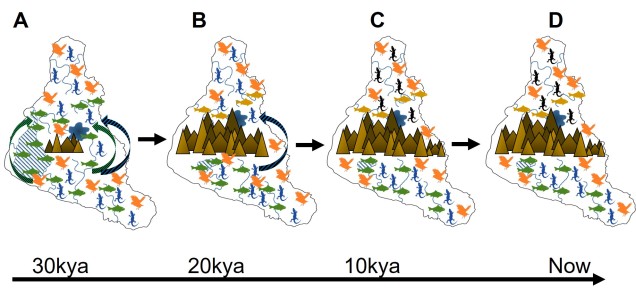
Although this can be hard to study in species of high extinction risk (getting a good number of samples is always an issue…), traditional phylogeographic methods might help us to make some comparisons. See, although the modern Earth is rapidly changing (undoubtedly influenced by human society), the climate of the globe has always varied to some degree. There has always been some tumultuousness in the climate and specific Earth history events like volcano eruptions, sea-level changes, or glaciation periods (‘ice ages’) have had diverse effects on organisms globally.
Using comparative phylogeography to predict species responses
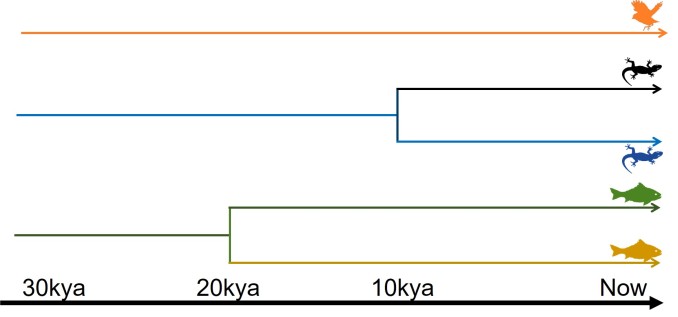
One tool for looking at how different species have, in the past, responded to the same biogeographical force is the domain of ‘comparative phylogeography’. Phylogeography itself is something we have discussed before: the ‘comparative’ aspect simply means comparing (with complex statistical methods) these patterns across different and often unrelated species to see how universal (‘congruent’) or unique (‘incongruent’) these patterns are among species. The more broadly we look at the species community in the region, the more we can observe widespread effects of any given environmental or geographical event: if we only look at fish, for example, we might not to be able to infer what response mammals, birds or invertebrates have had to our given event. Sometimes this still meets the scale we wish to focus; other times, we want to see how all the species of an area have been affected.


Typically, comparative phylogeographic studies have looked at the neutral components of species’ evolution (as is the realm of traditional phylogeography). This includes studying the size of populations over time, how well connected they are and were, what their spatial patterns are and how these relate to the environment. Comparing all of these patterns across species can allow us to start painting a fuller picture of the history of biota in a region. In this way, we can start to see exactly which species have shown what responses and start to relate these to the characteristics that allowed them to respond in that certain way (and including adaptation in our studies). So, what kinds of traits are important?
What traits matter? Who wins?
Often, we find that life history traits of an organism better dictates how they will respond to a certain pressure than other factors such as phylogeny (e.g. one group does not always do better than another). Instead, individual species with certain physical characteristics might handle the pressure better than others. For example, a fish, bird and snake that are all able to tolerate higher temperatures than other fish, birds or snakes in that region are more likely to survive a drought. In this case, none of the groups (fish, birds or snakes) inherently do better than the other two groups. Thus, it can be hard to predict how a large swathe of species will respond to any given environmental change, unless we understand the physical characteristics of every species.

We can also see that other physiological or ecological traits, such as climatic preferences and tolerance thresholds, can be critical for adapting to climatic pressures. Naturally, the genetic diversity of species is also an important component underlying their ability to adapt to these new selective pressures and to survive into the future. Trying to incorporate all of these factors into a projected model can be difficult, but with more data of higher quality we can start to make more refined predictions. But by understanding how particular traits influence how well a species may adapt to a changing climate, as well as knowing the what traits different species have, might just be the key to predicting who wins and who dies in the real-world Game of Thrones.

2 thoughts on “Surviving the Real-World Apocalypse”