Timing the phylogeny
Understanding the evolutionary history of species can be a complicated matter, both from theoretical and analytical perspectives. Although phylogenetics addresses many questions about evolutionary history, there are a number of limitations we need to consider in our interpretations.
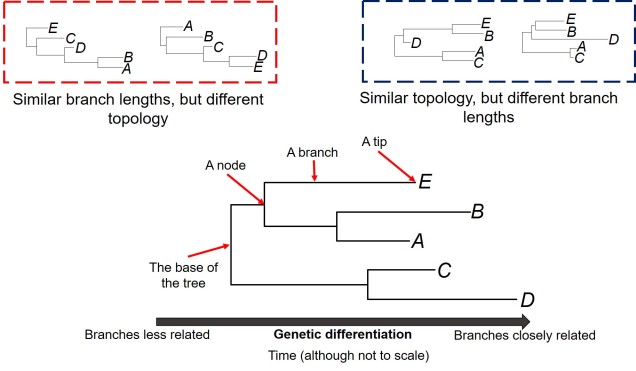
One of these limitations we often want to explore in better detail is the estimation of the divergence times within the phylogeny; we want to know exactly when two evolutionary lineages (be they genera, species or populations) separated from one another. This is particularly important if we want to relate these divergences to Earth history and environmental factors to better understand the driving forces behind evolution and speciation. A traditional phylogenetic tree, however, won’t show this: the tree is scaled in terms of the genetic differences between the different samples in the tree. The rate of genetic differentiation is not always a linear relationship with time and definitely doesn’t appear to be universal.

How do we do it?
The parameters
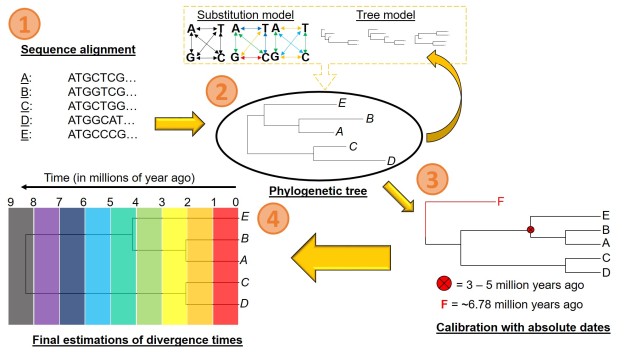
There are a number of parameters that are required for estimating divergence times from a phylogenetic tree. These can be summarised into two distinct categories: the tree model and the substitution model.
The first one of these is relatively easy to explain; it describes the exact relationship of the different samples in our dataset (i.e. the phylogenetic tree). Naturally, this includes the topology of the tree (which determines which divergences times can be estimated for in the first place). However, there is another very important factor in the process: the lengths of the branches within the phylogenetic tree. Branch lengths are related to the amount of genetic differentiation between the different tips of the tree. The longer the branch, the more genetic differentiation that must have accumulated (and usually also meaning that longer time has occurred from one end of the branch to the other). Even two phylogenetic trees with identical topology can give very different results if they vary in their branch lengths (see the above Figure).
The second category determines how likely mutations are between one particular type of nucleotide and another. While the details of this can get very convoluted, it essentially determines how quickly we expect certain mutations to accumulate over time, which will inevitably alter our predictions of how much time has passed along any given branch of the tree.
Calibrating the tree
However, at least one another important component is necessary to turn divergence time estimates into absolute, objective times. An external factor with an attached date is needed to calibrate the relative branch divergences; this can be in the form of the determined mutation rate for all of the branches of the tree or by dating at least one node in the tree using additional information. These help to anchor either the mutation rate along the branches or the absolute date of at least one node in the tree (with the rest estimated relative to this point). The second method often involves placing a time constraint on a particular node of the tree based on prior information about the biogeography of the species (for example, we might know one species likely diverged from another after a mountain range formed: the age of the mountain range would be our constraints). Alternatively, we might include a fossil in the phylogeny which has been radiocarbon dated and place an absolute age on that instead.

In regards to the former method, mutation rates describe how fast genetic differentiation accumulates as evolution occurs along the branch. Although mutations gradually accumulate over time, the rate at which they occur can depend on a variety of factors (even including the environment of the organism). Even within the genome of a single organism, there can be variation in the mutation rate: genes, for example, often gain mutations slower than non-coding region.
Although mutation rates (generally in the form of a ‘molecular clock’) have been traditionally used in smaller datasets (e.g. for mitochondrial DNA), there are inherent issues with its assumptions. One is that this rate will apply to all branches in a tree equally, when different branches may have different rates between them. Second, different parts of the genome (even within the same individual) will have different evolutionary rates (like genes vs. non-coding regions). Thus, we tend to prefer using calibrations from fossil data or based on biogeographic patterns (such as the time a barrier likely split two branches based on geological or climatic data).
The analytical framework
All of these components are combined into various analytical frameworks or programs, each of which handle the data in different ways. Many of these are Bayesian model-based analysis, which in short generates hypothetical models of evolutionary history and divergence times for the phylogeny and tests how well it fits the data provided (i.e. the phylogenetic tree). The algorithm then alters some aspect(s) of the model and tests whether this fits the data better than the previous model and repeats this for potentially millions of simulations to get the best model. Although models are typically a simplification of reality, they are a much more tractable approach to estimating divergence times (as well as a number of other types of evolutionary genetics analyses which incorporating modelling).

Despite the developments in the analytical basis of estimating divergence times in the last few decades, there are still a number of limitations inherent in the process. Many of these relate to the assumptions of the underlying model (such as the correct and accurate phylogenetic tree and the correct estimations of evolutionary rate) used to build the analysis and generate simulations. In the case of calibrations, it is also critical that they are correctly dated based on independent methods: inaccurate radiocarbon dating of a fossil, for example, could throw out all of the estimations in the entire tree. That said, these factors are intrinsic to any phylogenetic analysis and regularly considered by evolutionary biologists in the interpretations and discussions of results (such as by including confidence intervals of estimations to demonstrate accuracy).
Understanding the temporal aspects of evolution and being able to relate them to a real estimate of age is a difficult affair, but an important component of many evolutionary studies. Obtaining good estimates of the timing of divergence of populations and species through molecular dating is but one aspect in building the picture of the history of all organisms, including (and especially) humans.
