The nature of phylogeography
Studying the interaction of environmental changes and species evolution is a critical component for predicting how species might – or might not – respond to new environmental stressors induced by climate change. We can study this at a variety of different levels and using many different data types, ranging from ‘traditional’ ecological studies which correlate phenotypic changes and environment to more narrower studies of ecological genetics and how allelic frequencies change in association with environmental gradients.
In terms of the latter, many of these analyses fit within the realm of phylogeography, which seeks to correlate genetic patterns (diversity, divergence and demographics) with particular environmental forces to understand species history and evolution. This is often done at a historical timeframe and at relatively large spatial scales, which produce tangible signals for detection (particularly when small genetic datasets are available). Typically, we use neutral genetic variation (which attempts to avoid the compounding impact of local adaptation) and how it is partitioned across the landscape over time. For more nuanced methods, we might use coalescent modelling to directly test our hypotheses of how specific changes in the historical environment have impacted the genetic diversity and differentiation of our study species (singular or plural).

For example, we might use phylogeographic studies to try and understand which historical changes in the environment have driven the formation of biodiversity hotspots, or in understanding where (and how) common barriers to gene flow exist across the landscape.
Comparative phylogeography
One fundamental component of phylogeography is understanding how the results from one species might relate (or not) to others. This forms the foundation of comparative phylogeography, which compares these phylogeographic patterns across species to determine commonality in species responses. Comparative phylogeographic studies allow us to infer more broadly how specific environmental changes have impacted the ecosystem and biota therein, and make inferences about the broader implications of future and contemporary climate change.

Concordance and universality
This is often based on a ‘concordance and discordance’ paradigm, whereby species demonstrating responses to past environmental changes at similar times and in similar ways are deemed ‘concordant’. For example, the formation of a mountain range 20 million years ago might have created an isolating barrier across many different widespread groups (e.g. lizards, birds, fish and mammals), partitioning the biodiversity of the region and driving simultaneous divergences across a number of different taxa. From this, we can gather the importance of this mountainous barrier in promoting an increase in diversity in the broader region and how this might have influenced the evolutionary dynamics of the area.
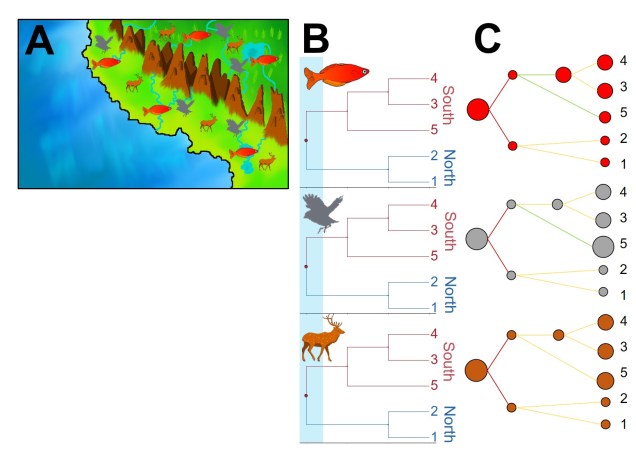
Discordance and species-specific responses
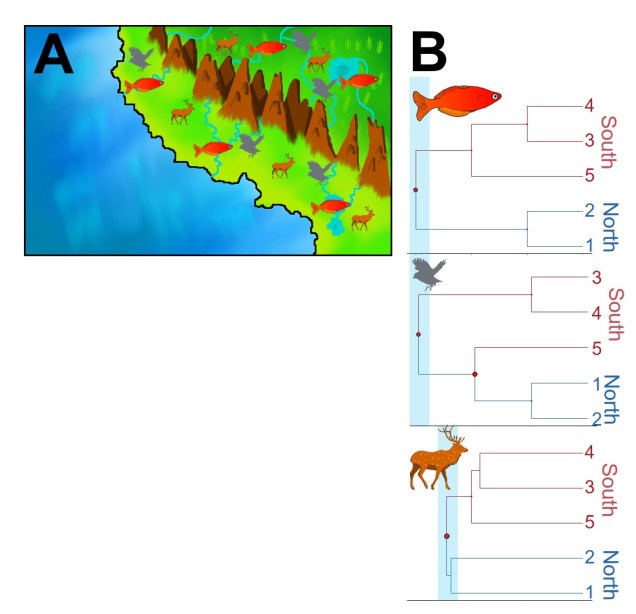
But what if the patterns aren’t shared? What if species didn’t respond to the same environmental pressure in the same way, or if the timing of these patterns are dissimilar? Following the previous example, what if we find that there is shared phylogeographic structure across the mountain range, but for fish this likely occurred >50 million years ago (and thus cannot be driven by the formation of the mountains alone)?
In this circumstance, we describe these patterns as being ‘discordant’. Discordance can occur via a number of different mechanisms, most commonly through different ecological characteristics of the species in question. One of the most commonly inferred drivers of discordance is in dispersal capability: environmental barriers which effectively block dispersal of some species might not act as strong barriers to others. In the case of the mountain range, this might not prevent birds from flying across (preventing the formation of highly divergent groups either side of the range) whereas the shifting hydrology might totally prevent fish from transferring across the mountain range (barring river capture).
In traditional comparative phylogeographic studies, discordance has been treated as somewhat of a nuisance result which discredits the universality of a single environmental mechanism driving divergence and diversity in a region. But discordance in and of itself is a fascinating result as it might help us determine which physiological traits of the study species is important in responding (or not) to environmental changes. This forms the basis of trait-based phylogeographic analyses, which might help us broadly determine how biota can respond to environmental changes based on their phenotypic traits.
Spatial variation in concordance
But there is also a spatial component to variation in discordance and concordance. The interaction between intraspecific forces – such as population-level factors including local adaptation, population structure and genetic diversity – and species-wide responses – including shifts in distribution and extinction or speciation – provides this context. In this sense, local-scale factors across species might be relatively concordant (i.e. populations of different species are similarly impacted at small spatial scales) but generate discordant species-scale responses (or vice versa). Localised environmental changes might result in shared responses in the immediate vicinity, but the decaying effect at broader scales leads to more discordant changes in the species-wide distribution. Similarly, variation in concordance might occur temporally, with short-term concordance in responses to an environmental change but discordance in the longer term based on post-environmental change evolution.

An example of temporal variation in concordance
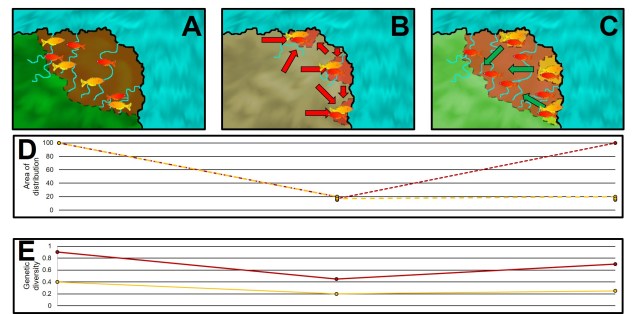
This might be a little difficult to visualise, so let’s go with an example. A particularly notable way this spatial variation in concordance has been observed is through habitat refugia over time: with changes in the global climate in the past, many species retracted to small, isolated suitable habitats. These refugia might be shared across a number of different species, which have similar limitations in survivable climates. At this temporal and spatial scale, we would describe these retractions (and likely associated genetic bottlenecks) as concordant.
However, as the climate shifts back to more suitable conditions, each of these species may expand from their refugia. This is where discordance might arise, if the subsequent timing or scale of the expansion is not similar across species. For example, if the genetic bottleneck was more severe in one species over others – or if (by genetic drift) one species retained more useful adaptive genetic diversity than others – some species might have retained the ability to colonise these newly available environments but others not. Thus, when we look at their phylogeographic patterns today we see highly discordant ranges and genetic diversity not as a result of discordant refugia but from discordant post-refugial changes.
Predicting complex species responses
The complex interaction of species ecology, environmental changes and adaptive potential is a critical component for predicting how (and which) species might be able to cope (to certain degrees) with climate change. Improving our understanding of which traits (genetic, phenotypic or phylogeographic) are important in providing adaptive potential under human-induced clim ate change can help us allocate resources to those most threatened. As with everything in biology, the systems we work with are highly multifaceted but becoming better illuminated with each study of their evolution. In time, we may be able to predict who the winners and losers of climate change are – and how best to mitigate the mass extinction crisis we are in.

One thought on “In accordance with evolution: discordance and concordance in phylogeography”