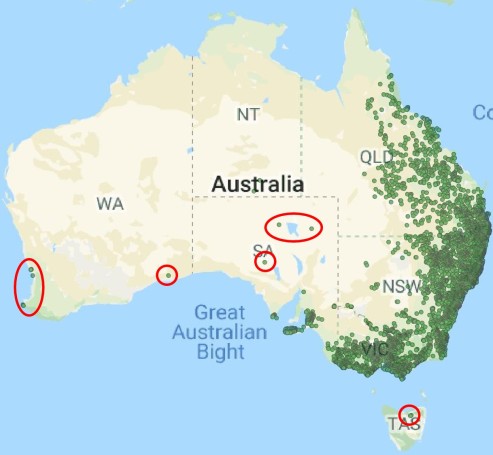
Where on Earth are species?
Understanding the spatial distribution of species is a critical component for many different aspects of biological studies. Particularly for conservation, the biogeography of regions is a determinant factor for designating and managing biodiversity hotspots and management units. Or understanding the biogeographical mechanisms that have shaped modern biodiversity may allow us to understand how species will change under future climate change scenarios, and how their distributions will (and have) shift(ed).
Typically, the maximum distribution of species is based on their ecological tolerances: that is, the most extreme environments they can tolerate and proliferate within. Of course, there are a huge number of other factors on top of just natural environment which can shape species distributions, particularly related to human-induced environmental changes (or introducing new species as invasive pests, which we seem to be good at). But exactly where species are and why they occur there are intrinsically linked to the adaptive characteristics of species relative to their environment.
Species distribution modelling
The connection of a species distribution with innate environmental tolerances is the background for a type of analysis we call species distribution modelling (SDM) or environmental niche modelling (ENM). Species distribution modelling seeks to correlate the locations where a species occurs with the local environment around those sites to predict where the species should occur. This is an effective tool for trying to understand the distribution of species that might be tricky to study so thoroughly in the wild; either because they are hard to catch, live in very remote areas, or because they are highly threatened. There are a number of different algorithms and data types that will work with SDM, and there is always ongoing debate about ‘best practices’ in modelling techniques.

A basic how-to on running SDM
The first major component that is needed for SDM is the occurrence data. Some methods will work with presence-only data: that is, a map of GPS coordinates which describes where that species has been found. Others work with presence-absence data, which may require including sites of known non-occurrence. This is an important aspect as the non-occurring sites defines the environment beyond the tolerance threshold of the species: however, it’s very likely that we haven’t sampled every location where they occur, and there will be some GPS co-ordinates that appear to be absent of our species where they actually occur. There are some different analytical techniques which can account for uneven sampling across the real distribution of the species, but they can get very technical.

The second major component is our environmental data. Typically, we want to include environmental data for the types of variables that are likely to constrain the distribution of our species: often temperature and precipitation variables are included, as these two largely predict habitat types. However, it can also be important to include non-climatic variables such as topography (e.g. elevation, slope) in our model to help constrain our predictions to a more reasonable area. It is also important to test for correlation between our variables, as using many variables which are highly correlated may ‘overfit’ the model and underestimate the range of the distribution by placing an unrealistic number of restrictions on the model.

Our SDM analysis of choice (e.g. MaxEnt) will then use various algorithms to build a model which best correlates where the species occurs with the environmental variables at those sites. The model tries to create a set of environmental conditions that best encapsulate the occurrence sites whilst excluding the non-occurrence sites from the prediction. From the final model, we can evaluate how strong the effect of each of our variables is on the distribution of the species, and also how well our overall model predicts the locality data.
Projecting our SDM into the past and the future
One reason to use SDM is the ability to project distributions onto alternative environments based on the correlative model. For example, if we have historic data (say, from the last glacial maximum, 21,000 years ago), we can use our predictions of how the species responds to climatic variables and compare that to the environment back then to see how the distribution would have shifted. Similarly, if we have predictions for future climates based on climate change models, we can try and predict how species distributions may shift in the future (an important part of conservation management, naturally).

Species distribution modelling continues to be a useful tool for conservation and evolution studies, and improvements in analytical algorithms, available environmental data and increased sampling of species will similarly improve SDM. Particularly, improvements in environmental projections from both the distant past and future will improve our ability to understand and predict how species will change, and have changed, with climatic changes

3 thoughts on “The MolEcol Toolbox: Species Distribution Modelling”