Coalescent theory
A recurring analytical method, both within The G-CAT and the broader ecological genetic literature, is based on coalescent theory. This is based on the mathematical notion that mutations within genes (leading to new alleles) can be traced backwards in time, to the point where the mutation initially occurred. Given that this is a retrospective, instead of describing these mutation moments as ‘divergence’ events (as would be typical for phylogenetics), these appear as moments where mutations come back together i.e. coalesce.
There are a number of applications of coalescent theory, and it is particularly fitting process for understanding the demographic (neutral) history of populations and species.
Mathematics of the coalescent
Before we can explore the multitude of applications of the coalescent, we need to understand the fundamental underlying model. The initial coalescent model was described in the 1980s, built upon by a number of different ecologists, geneticists and mathematicians. However, John Kingman is often attributed with the formation of the original coalescent model, and the Kingman’s coalescent is considered the most basic, primal form of the coalescent model.
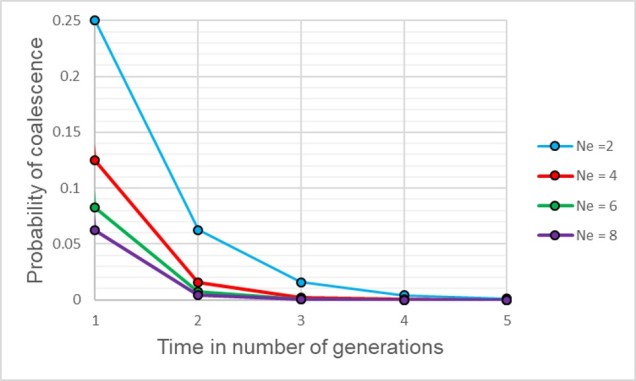
From a mathematical perspective, the coalescent model is actually (relatively) simple. If we sampled a single gene from two different individuals (for simplicity’s sake, we’ll say they are haploid and only have one copy per gene), we can statistically measure the probability of these alleles merging back in time (coalescing) at any given generation. This is the same probability that the two samples share an ancestor (think of a much, much shorter version of sharing an evolutionary ancestor with a chimpanzee).
Normally, if we were trying to pick the parents of our two samples, the number of potential parents would be the size of the ancestral population (since any individual in the previous generation has equal probability of being their parent). But from a genetic perspective, this is based on the genetic (effective) population size (Ne), multiplied by 2 as each individual carries two copies per gene (one paternal and one maternal). Therefore, the number of potential parents is 2Ne.

If we have an idealistic population, with large Ne, random mating and no natural selection on our alleles, the probability that their ancestor is in this immediate generation prior (i.e. share a parent) is 1/(2Ne). Inversely, the probability they don’t share a parent is 1 − 1/(2Ne). If we add a temporal component (i.e. number of generations), we can expand this to include the probability of how many generations it would take for our alleles to coalesce as (1 – (1/2Ne))t-1 x 1/2Ne.

Although this might seem mathematically complicated, the coalescent model provides us with a scenario of how we would expect different mutations to coalesce back in time if those idealistic scenarios are true. However, biology is rarely convenient and it’s unlikely that our study populations follow these patterns perfectly. By studying how our empirical data varies from the expectations, however, allows us to infer some interesting things about the history of populations and species.
Testing changes in Ne and bottlenecks
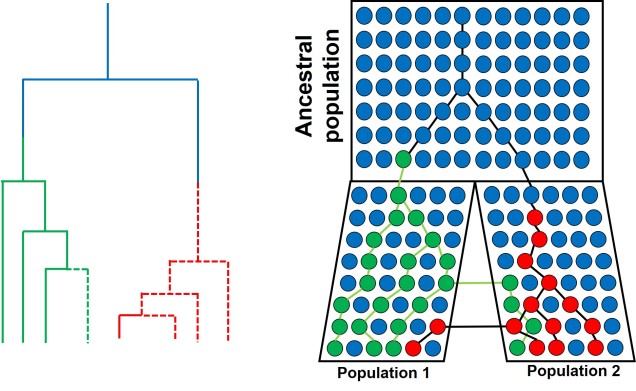
One of the more common applications of the coalescent is in determining historical changes in the effective population size of species, particularly in trying to detect genetic bottleneck events. This is based on the idea that alleles are likely to coalesce at different rates under scenarios of genetic bottlenecks, as the reduced number of individuals (and also genetic diversity) associated with bottlenecks changes the frequency of alleles and coalescence rates.
For a set of k different alleles, the rate of coalescence is determined as k(k – 1)/4Ne. Thus, the coalescence rate is intrinsically linked to the number of genetic variants available: Ne. During genetic bottlenecks, the severely reduced Ne gives the appearance of coalescence rate speeding up. This is because alleles which are culled during the bottleneck event by genetic drift causes only a few (usually common) alleles to make it through the bottleneck, with the mutation and spread of these alleles after the bottleneck. This can be a little hard to think of, so the diagram below demonstrates how this appears.

This makes sense from theoretical perspective as well, since strong genetic bottlenecks means that most alleles are lost. Thus, the alleles that we do have are much more likely to coalesce shortly after the bottleneck, with very few alleles that coalesce before the bottleneck event. These alleles are ones that have managed to survive the purge of the bottleneck, and are often few compared to the overarching patterns across the genome.
Testing migration (gene flow) across lineages
Another demographic factor we may wish to test is whether gene flow has occurred across our populations historically. Although there are plenty of allele frequency methods that can estimate contemporary gene flow (i.e. within a few generations), coalescent analyses can detect patterns of gene flow reaching further back in time.
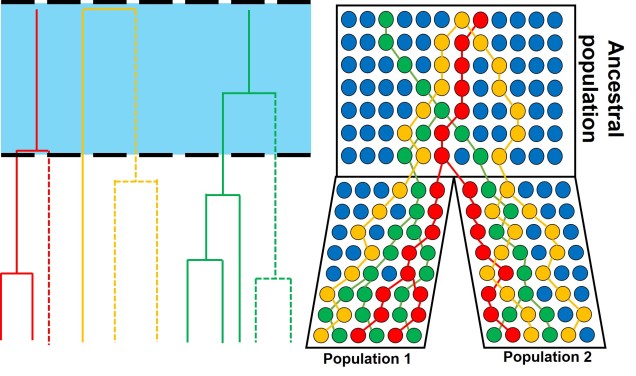
In simple terms, this is based on the idea that if gene flow has occurred across populations, then some alleles will have been transferred from one population to another. Because of this, we would expect that transferred alleles coalesce with alleles of the source population more recently than the divergence time of the two populations. Thus, models that include a migration rate often add it as a parameter specifying the probability than any given allele coalesces with an allele in another population or species (the backwards version of a migration or introgression event). Again, this might be difficult to conceptualise so there’s a handy diagram below.

Testing divergence time
In a similar vein, the coalescent can also be used to test how long ago the two contemporary populations diverged. Similar to gene flow, this is often included as an additional parameter on top of the coalescent model in terms of the number of generations ago. To convert this to a meaningful time estimate (e.g. in terms of thousands or millions of years ago), we need to include a mutation rate (the number of mutations per base pair of sequence per generation) and a generation time for the study species (how many years apart different generations are: for humans, we would typically say ~20-30 years).

The basic model of testing divergence time with the coalescent is relatively simple, and not all that different to phylogenetic methods. Where in phylogenetics we relate the length of the different branches in the tree to the amount of time that has occurred since the divergence of those branches, with the coalescent we base these on coalescent events, with more coalescent events occurring around the time of divergence. One important difference in the two methods is that coalescent events might not directly coincide with divergence time (in fact, we expect many do not) as some alleles will separate prior to divergence, and some will lag behind and start to diverge after the divergence event.
The complex nature of the coalescent
While each of these individual concepts may seem (depending on how well you handle maths!) relatively simple, one critical issue is the interactive nature of the different factors. Gene flow, divergence time and population size changes will all simultaneously impact the distribution and frequency of alleles and thus the coalescent method. Because of this, we often use complex programs to employ the coalescent which tests and balances the relative contributions of each of these factors to some extent. Although the coalescent is a complex beast, improvements in the methodology and the programs that use it will continue to improve our ability to infer evolutionary history with coalescent theory.

7 thoughts on “Bringing alleles back together: applications of coalescent theory”